Many companies measure and track customer satisfaction via Net Promoter Score or another type of satisfaction instrument. While these tools are effective at determining satisfaction levels and tracking changes over time, they typically do not identify what is actually driving customer satisfaction.
We often use Kano analysis to reveal those drivers. It considers both the combination and interaction of product/program attributes in addition to examining each attribute separately. Using correlation analysis to establish the connection between individual attributes and customers’ overall satisfaction, we are able to plot derived importance and current satisfaction for each attribute.
By focusing on the attributes that are strongly impacting overall satisfaction, we can highlight areas where improvements will garner the largest satisfaction gains. Kano is excellent for:
Each measured attribute of a product or company can be plotted and will fall into a quadrant on the data plot. Three of the quadrants are of note: Threshold, Performance, and Excitement.
Below is a graph from an actual client with identifying information removed:
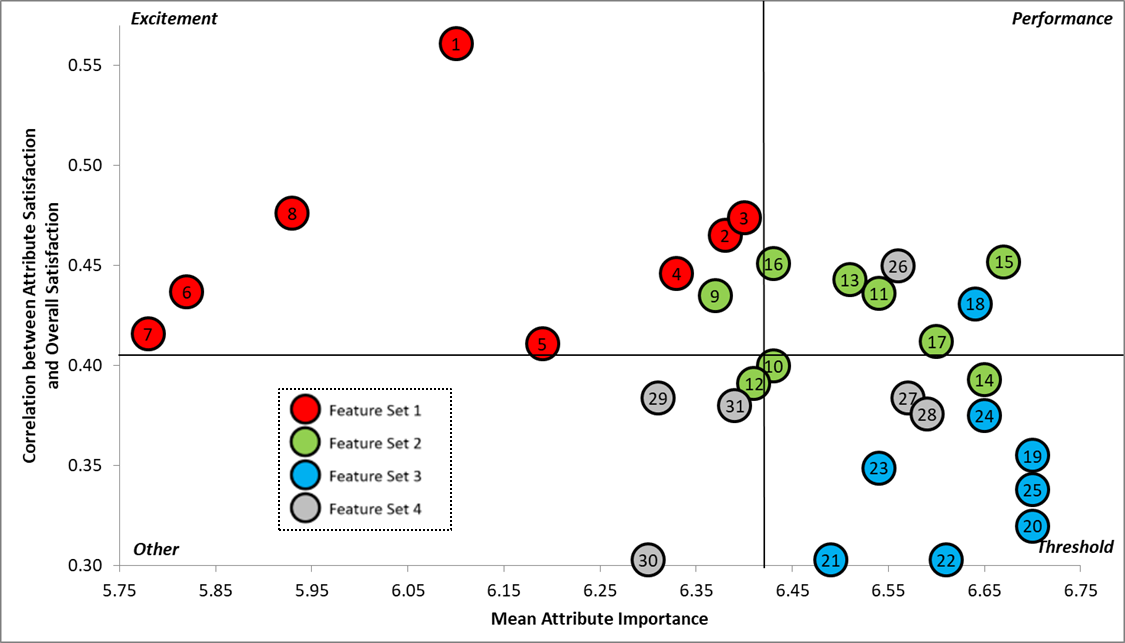
Threshold attributes are the basic expectations for a product or service. For example, a car buyer would expect the car to have brakes. If they are functional brakes, nothing more is needed and extra features won’t return a higher level of satisfaction. If a company performs poorly on a threshold attribute, however, it needs to be addressed immediately as meeting threshold attributes is required to be a viable option for buyers in a market.
Performance attributes are strongly correlated with overall satisfaction. These are a product/service’s “signature attributes.”
An example of a performance attribute would be gas mileage on a car. The higher the gas mileage, the more satisfied the customer and the better he/she feels about owning the vehicle. In other words, with performance attributes, more is better.
In our real-world example, you can see there are attributes from feature sets 2, 3, and 4 that are performance attributes. This gave the client great insight about where to focus attention on improvements, especially for those attributes that had a qualifying gap in satisfaction. Performance attributes can provide direction for marketing strategy, too, particularly if you gain Kano results for key competitors and not just your customers.
Excitement attributes are “unexpected delights” to consumers.
An example of an excitement attribute would be a heated driver’s seat. It’s not an expectation of most drivers, but it is a nice bonus to the experience that the car owner appreciates when it’s present. Often, over time, an excitement attribute will become a threshold attribute if the industry adopts it.
In our real-world example, you can see that all of the attributes from feature set 1 were excitement attributes. Our client chose to focus on these attributes going forward to help increase their customer’s overall satisfaction.
Understanding the “whys” behind your satisfaction scores and your competitors’ scores will put you ahead of the pack. Here are a few examples of how past clients have benefited:
If you’d like to know more about Kano analysis, reach out to Linda Kuster (lkuster@vernonresearch.com) or Andrew Juhl (ajuhl@vernonresearch.com).
Or you can use our contact form. [ninja_form id=1]